Glacier outline, area and calving front
Background
Glacier outlines, area changes and position of calving fronts are being mapped for glaciers in mainland Norway and Svalbard in the Copernicus Glacier Service project using Sentinel-2 and Landsat 8.
Mainland Norway: A new glacier mask for mainland Norway was created using Sentinel-2 imagery for 2018 and 2019. Results are published in a report and a paper (Andreassen, 2022; Andreassen et al., 2022). Regional studies published includes recent Landsat imagery and digitising historical maps, glacier landforms and orthophotos (Stokes et al., 2018, Leigh et al., 2019, Weber et al., 2019, Weber et al., 2020a; 2020b, Andreassen et al., 2020). Some work has also been done testing Sentinel-1 where averaged summer SAR images were found to have potential in assisting the process of mapping glaciers outlines, especially in the presence of seasonal snow (Winsvold et al., 2018).
Svalbard: A new digital glacier inventory has been made based on Sentinel-2 imagery from summer 2020. The inventory is consistent with the 2001-2010 Glacier Area Outlines by König et al. (2013). Calving front locations of tidewater glaciers have been further mapped on an annual basis since 2012 using Sentinel-2 and Landsat imagery, primarily from the period 15 August - 15 September each year. All glacier inventories and annual calving fronts can be visualized on Svalbardkartet. Shapefiles with the new glacier inventory and the annual frontlines can be downloaded from the NPI data centre on the links below. A combined dataset with annual coastlines for the entire Svalbard is also provided. We further plan to publish derived results of annual retreat rates, area/volume changes, ice discharge and total frontal ablation (sum of melting and calving).

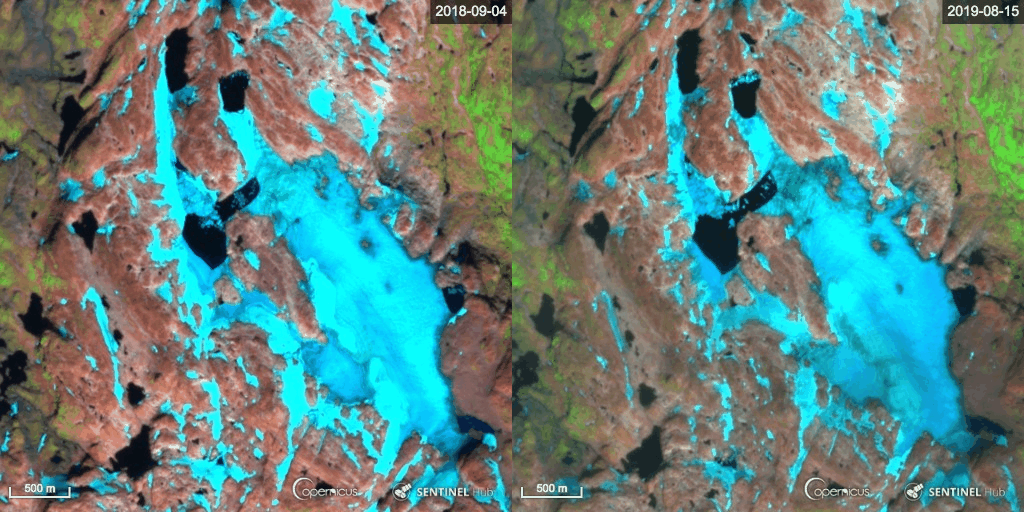
Sentinel-2 imagery illustrating changes of Storskavlen, Norway, from 2018 to 2019. Note the growth of the glacier lakes.
Data for download
Mainland Norway
Norway Glacier Area outlines 2018-2019: Data set as handle
-Lyngen Landsat 2014 data is submitted and available for download from the GLIMS database.
Reference: Stokes et al. (2018)
-Hardangerjøkulen LIA (1750; based on glacial landforms), 1923-29 (historical gradteigskart map), 2013 (vertical aerial photographs) Glacier outlines Hardangerjøkulen Reference: Weber et al. (2019).
-Nordland 1900 (historical gradteigskart maps) Glacier outlines Nordland 1900 Gradteigskart
Reference: Weber et al. (2020).
-Langfjordjøkelen LIA (1925; based on glacial landforms), 1945, 2015 (both based on vertical aerial photographs)
Glacier outlines Langfjordjøkelen Reference: Weber et al. (2020a).
-Vestre Svartisen (Fonndalsbreen-Engabreen-Litlbreen) LIA (1750; based on glacial landforms)
Glacier outlines Vestre Svartisen LIA Reference: Weber et al. (2020b).
Svalbard
Lith, A., G. Moholdt & J. Kohler. 2021. Svalbard glacier inventory based on Sentinel-2 imagery from summer 2020 [Data set]. Norwegian Polar Institute. https://data.npolar.no/dataset/1b8631bf-7710-449a-a56f-0da1a4fef608
Moholdt, G., J. Maton, M. Majerska & J. Kohler. 2021. Annual frontlines of marine-terminating glaciers on Svalbard [Data set]. Norwegian Polar Institute. https://doi.org/10.21334/npolar.2021.d60a919a
Moholdt, G., J. Maton, M. Majerska & J. Kohler. 2021. Annual coastlines for Svalbard [Data set]. Norwegian Polar Institute. https://data.npolar.no/dataset/21565514-ab3a-432a-ae42-2587bea95a97
References
Andreassen, L.M. (2022) Breer og fonner i Norge. NVE Rapport 3-2022, 48 s.
Andreassen, L.M., T. Nagy, B. Kjøllmoen, J R. Leigh. 2022. An inventory of Norway’s glaciers from 2018–19 Sentinel-2 data. Journal of Glaciology. In review.
Andreassen, L.M., H. Elvehøy, B. Kjøllmoen, J.M.C. Belart. 2020. Glacier change in Norway since the 1960s – an overview of mass balance, area, length and surface elevation changes. Journal of Glaciology 1–16. doi.org/10.1017/jog.2020.10
König, M., J. Kohler & C. Nuth. 2013. Glacier Area Outlines - Svalbard [Data set]. Norwegian Polar Institute. doi.org/10.21334/npolar.2013.89f430f8
Leigh, J.R, Stokes, C.R., Carr, R.J., Evans, I.S., Andreassen, L.M. and Evans, D.J.A. 2019. Identifying and mapping very small (<0.5 km2) mountain glaciers on coarse to high-resolution imagery. Journal of Glaciology, 1–17. doi:10.1017/jog.2019.50
Stokes, S., L.M. Andreassen, M.R. Champion, G. D. Corner. 2018. Widespread and accelerating glacier retreat on the Lyngen Peninsula, northern Norway, since their ‘Little Ice Age’ maximum. Journal of Glaciology, 64(243), 100-118. doi:10.1017/jog.2018.3
Weber, P., C.M. Boston, H. Lowell and L.M. Andreassen. 2019. Evolution of the Norwegian plateau
icefield Hardangerjøkulen since the ‘Little Ice Age’. The Holocene, 1-21, doi/10.1177/0959683619865601.
Weber, P. H. Lovell, L.M. Andreassen, C.M. Boston. 2020a. Reconstructing the Little Ice Age extent of Langfjordjøkelen, northernmost Arctic Norway, as a baseline for assessing centennial-scale icefield recession. Polar Research, 39. doi.org/10.33265/polar.v39.4304 (pdf)
Weber, P., L.M. Andreassen, C. M. Boston, H. Lovell, H. and S. Kvarteig. 2020b. An ~1899 glacier inventory for Nordland, northern Norway, produced from historical maps. Journal of Glaciology, 1-19. doi.org/10.1017/jog.2020.3
Winsvold, S.H., A. Kääb, C. Nuth, L.M. Andreassen, W van Pelt, and T. Schellenberger. 2018. Using SAR satellite data time-series for regional glacier mapping. The Cryosphere, 12, 867-890, doi.org/10.5194/tc-12-867-2018.
